Das aktuelle Wetter auf Mauritius
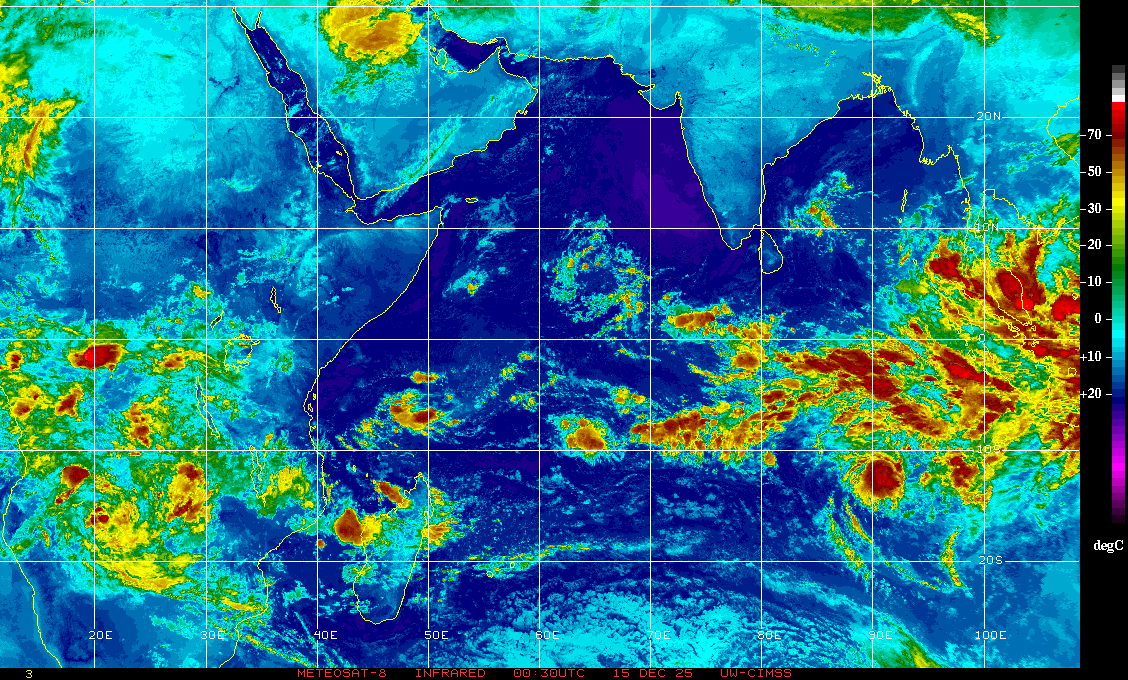
Satelliten Bilder

Satellite Bilder Mauritius

Wettervorhersage

Wettervorhersage Mauritius

Zyklon beobachtung

Mauritius Zyklon beobachtung

Unsere Wetter Seite gibt es nun schon seit 2008 und gibt Ihnen aktuelle Daten über die Temperatur – Wind – Regen – Barometer – Luftfeuchte – Luftdruck etc. Alle Wetterdaten werden von unserer Privaten Wetterstation (eine David Vantage Pro2) generiert und alle 4-10 Sek. für Sie Online gestellt.

Neu ist unsere Visualisierung von Wind in Mauritius und bitte beachten Sie auch unsere, Zyklon Informationen, sowie als erst Urlauber natürlich die Klimatabelle, damit Sie rundum informiert sind.


METRIC | IMPERIAL
Updated: 22/09/2023 @ 06:21  
Temperature Current Conditions Forecast / Storm Prediction
Currently Outside: Colder 0.2°C than last hour.

23.2°C

Feels like:  29°C
---
High Today
23.6°C
00:00
Low Today
23.1°C
03:33
Yest High
26.6°C
13:34
Yest Low
22.9°C
04:30
Sta* High
26.4°C
2018
Sta* Low
18.9°C
2021
* Records from this Station Since 2011
(For this day)
Mainly cloudy, Dry It is Mainly cloudy, Dry

Wind from E Wind:  E
4.4

Gusting to:
0.0 km/h
Current Rain Rain:
0.0 mm
Chandler Burning Index: MINIMAL Current CBI
Fire Danger:
3.6 of 100


Click here for full Forecast
SAT Map
Dew Point Liquid Precipitation Wind Sun/Moon
Dew Point: Decreased 0.4°C since last hour. 17.8°C
In Last Hour: Decreased 0.4°C since last hour. 0.4°C
High Dew
Point:
18.7°C
at 00:00
Low Dew
Point:
17.8°C
at 06:19
Record Dew
Point:
28.0°C
24/02/2013
Wetbulb: 19.8°C
Today: 0.00 mm
Yesterday: 0.20 mm
Last 7 Days: 4.60 mm
September Rain: 13.80 mm
September Avg: 29.80 mm
Diff from Avg: Under 16 mm for the month -16.00 mm
Rain Season:1 854.0 mm
Last YTD Rain:1 1329.4 mm
Last Rain
Time/Date:
21/9/2023
at 10:06
158 rain days in 2023
11 days in September
1 day since last rain
Currently: E at
4.4 km/h
Gusting To: 0.0
Max Gust: 22.505:15
1Hr Average: 5.8 km/h
Month Gust: 41.8 km/h Sep 2
Year Gust: 79.6 km/h Feb 20
Record Gust: 165.8 km/h
on 15-Feb-2013
Wind Run: km
night

day
Daylight:
12:06

+1:09
Min:Sec

Evening Crescent, 7 days, 0 hours, 41 minutes in cycle
43%
Illuminated
Humidity Barometer
Humidity: Decreased 1% since last hour. 72 %
In Last Hour: -1%
High
Today
75%
at 02:41
Low
Today
72%
at 05:38
Current: Rising 0.5  hPa/hr 1020.2 hPa
In Last Hour: Steady
High
Today:
1020.4
at 00:02
Low
Today:
1018.9
at 03:14
Cooling Degree Days Lightning Strikes Heat Index Air
Today: 1.3
September: 115.1
2023 to Date: 1707.8
Heating Degree Days
2023 to Date: 0.0
Last Min: 0
Last 30 Mins: 0
Last 60 Mins: 0
Last 12 Hrs: 0
September: 0
2023 to Date: 0
Last
Strike:
11:25:18 2021/29/12
Current: 24.1°C
Today: 23.6°C 
Yesterday: 26.6°C
Record: 47.3°C
08/02/2022
Data Not
Available


Data Not Available
Density:
1.19 kg/m3
Current UV Index Current Solar Energy9
0.0
Sunburn in
720 Minutes
Highest:
00:00
0.0
25 W/m2
36%
W/m2 SI
High Today:
06:20
25  W/m2 Record:1622 W/m2
Almanac Irrigation Index5 Station All Time Records Cloud Level
Currently: Morning
YTD Avg Temp: 24.8°C
Sunrise: 05:59
Sunset: 18:05
Moonrise: 10:47
Moonset: 00:43
Full Moon:
29 septembre 2023
New Moon:
17:56 UTC 14 octobre 2023
Updated at Midnight
Current ET: 0.80 mm
7-Days Rain: 4.60 mm
7-Days ET: 37.00 mm
7-Day:  32.4 mm water in deficit of what evaporated in last 7 days. -32.4 mm 32.4 mm water in deficit of what evaporated in last 7 days. mm
September:  94.7 mm water in deficit of what evaporated this month. -94.7 mm
HIGHS: LOWS:
34.8°C
08/02/2022
-25.2°C
05/10/2015
Daytime Records
  30.5°C
18/01/2022
  18.7°C
22/07/2018
Nitetime Records
  28.8°C
29/12/2013
  17.7°C
19/07/2018
ICN:19 | S3C2:3
ISS:Ok | CON:4.4 | RCP:99%
1 Rain season: Jan 1st to Dec 31st.    5 Estimated amount of water needed to replace the water used by plants and evaporation from the past week. (Negative numbers mean amount of water needed, positive numbers mean excess water is present.) 6 Air Quality Index is provided by Minnesota Polution Control Agency and is updated hourly between the hours of 6AM and Midnight. 9 Solar Index represents either an absolute scale of solar energy (W/m²) using the station’s recorded maximum or a percentage of computed theoretical solar maximum using the station’s location and time of day. These indices differ most when the sun is low on the horizon. The current scale is shown, and will toggle if it or the icon is clicked.  
 WU Weather Forecast  -   Outlook  &

WU forecast:

WU forecast:
Animated icons courtesy of www.meteotreviglio.com
Version 6.81 20-MAR-2013 - Script Mods by: BurnsvilleWeatherLIVE.com